Efficacy of Fungicides for Control of Dollar Spot
Efficacy of fungicides for control of dollar spot in a mixed creeping bentgrass/Poa annua soil-based green, 2004.
The test was conducted on a Maury silt loam located at the University of Kentucky Turf Research Center near Lexington. The turf was maintained at 0.188-in. mowing height and fertilized with 1.5 lb N/1000 sq ft as urea on Oct and Nov 03, and with 1.0 lb N/1000 sq ft as urea on Jun 04. The green was intentionally maintained as nitrogen-deficient through the test period, in order to evaluate performance of fungicides under low-fertility conditions. Plots measured 4 ft x 4 ft with 2-ft borders, and were arranged in a randomized complete block design with three replications. Fungicide sprays were applied using a CO2-pressurized hand-held sprayer fitted with Spraying Systems 8003E flat-fan nozzles delivering 1.5 gal/1000 sq ft. Most treatments were first applied on 20
May, with the remaining treatments applied according to the schedules indicated in the table (final application on 28 Jul). Where tank-mixes were alternated, sprays were applied every two weeks, with each tank-mix being applied once every four weeks. Visual counting of dollar spot infection centers were obtained weekly, although only selected, representative assessments are provided because of space constraints. The level of infestation by Poa annua was visually estimated on 27 May, when color differences between the two grass species and the presence of Poa annua seed heads facilitated discrimination. The amount of Poa annua per plot averaged 41.3% and did not differ significantly between treatments. Transformed data (log10) were analyzed using ANOVA and
Waller-Duncan k-ratio t-test, (k=100, P=0.05). Although statistics provided are based on analysis of transformed data, arithmetic means are presented in order to provide a better indication of the level of disease control provided by each treatment as well as the overall disease pressure in the trial.
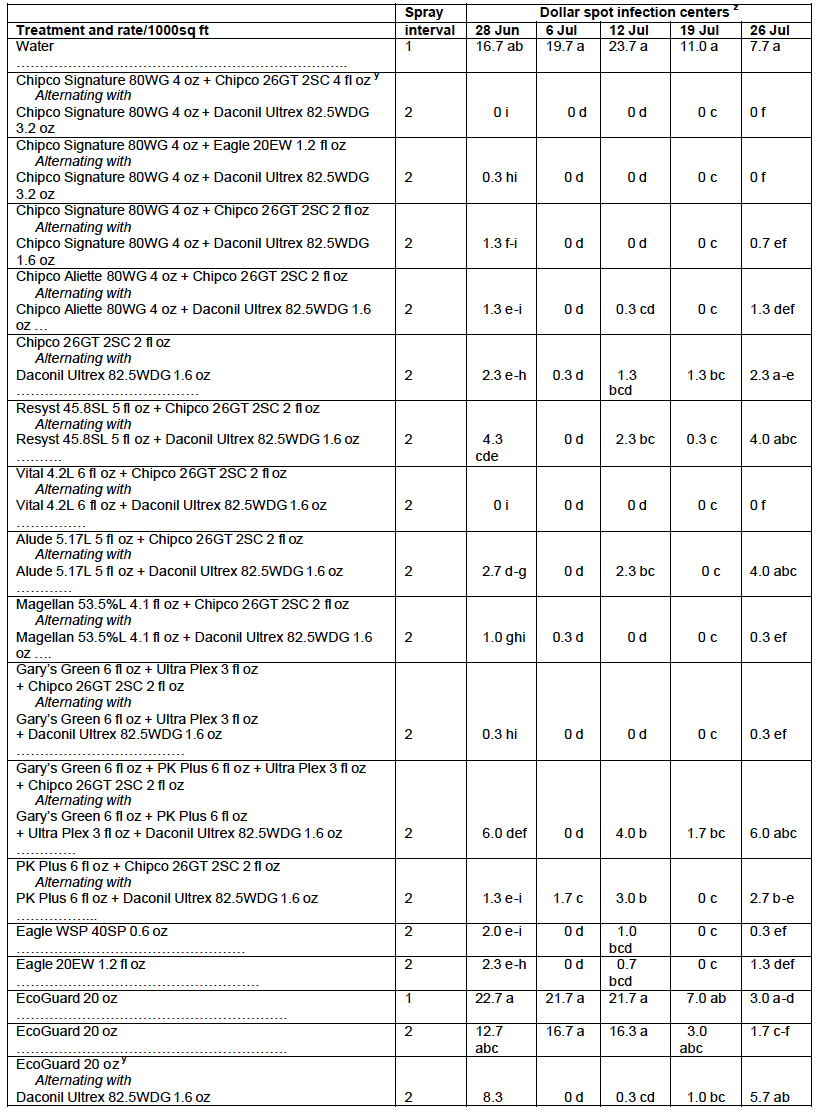
Weather was moderately favorable for dollar spot activity during the test period. Disease pressure was moderate to low and most of the fungicides were effective at controlling dollar spot with the following exceptions: EcoGuard sprayed alone at 1 and 2 week intervals, and Daconil Ultrex near the end of the 4-week spray interval. As dis ease pressure became moderate (late-June to mid-July), the Resyst and Alude tank-mix spray programs produced significantly less control of dollar spot as compared with the equivalent Signature tank-mix program. On several assessment dates, the addition of P-K Plus® to the Gary’s Green® + Fungicide tank-mix resulted in a small but significant loss in dollar spot control. Plots treated with EcoGuard with and without Daconil Ultrex, and the alternating tank mix with Gary’s Green, Ultraplex®, and Chipco26GT alternating with Gary’s Green, Ultraplex, and Daconil Ultrex exhibited a noticeable darker green color than unsprayed plots on 24 May. No other phytotoxicity or growth regulator effects were noted in the trial.
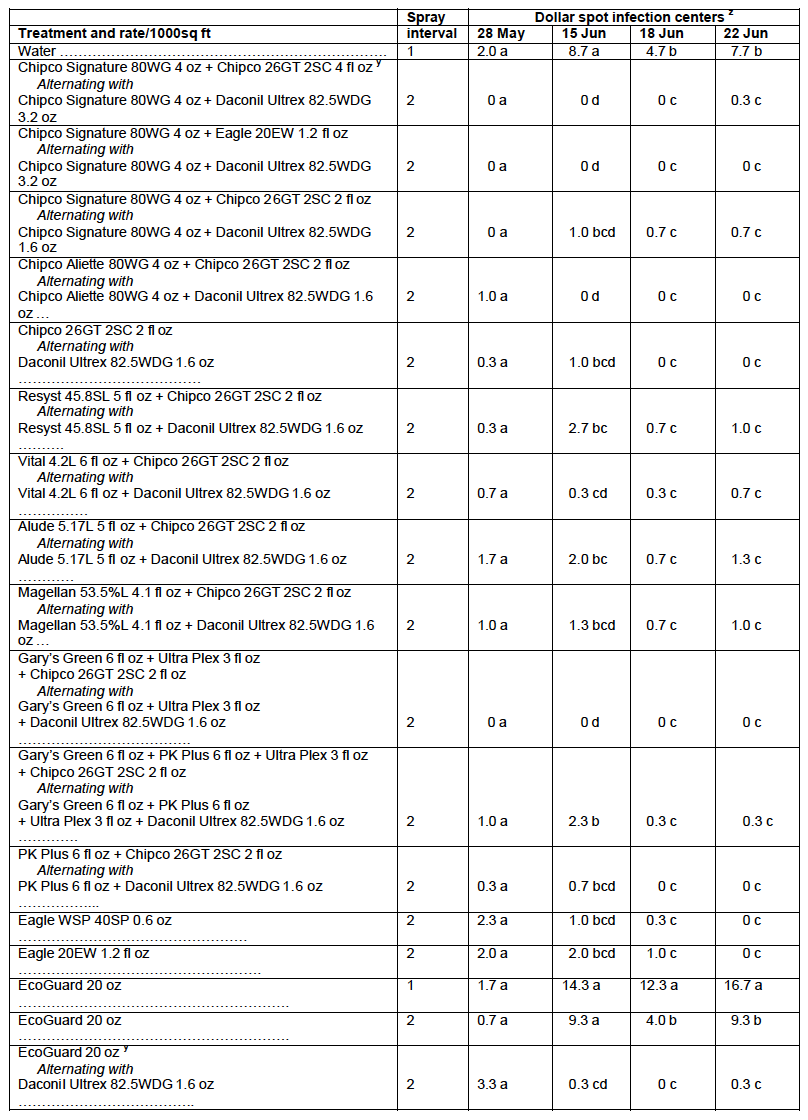
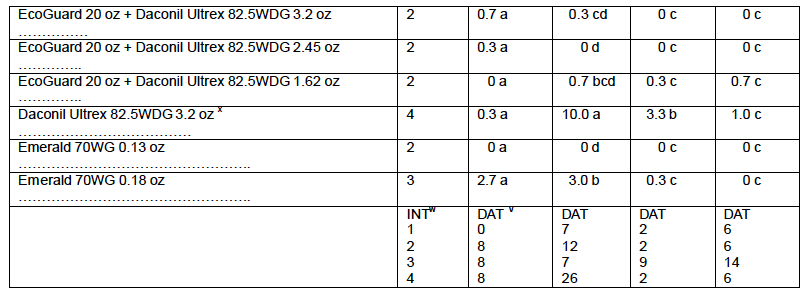
z Means within the same column followed by the same letter are not significantly different, Waller-Duncan k-ratio t-test (k=100, P=0.05). Arithmetic means are presented with statistical groupings based on log10 transformed data.
y One of the two tank-mixes was applied alternately at two week intervals between 20 May and 28 Jul.
x Applications coincided with Daconil Ultrex applicationd in the EcoGuard/Daconil alternating treatment.
w INT=interval between sprays in weeks.
v DAT= number of days after treatment the data were taken.
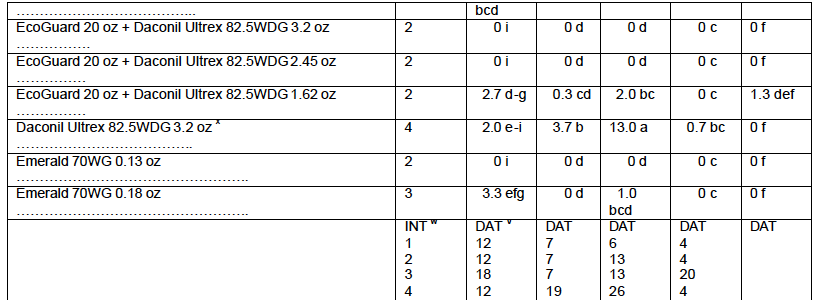