Effects of Various Soluble Organic Nitrogen and Phosphorus Fertilizers
Effects of Various Soluble Organic Nitrogen and Phosphorus Fertilizers Derived from Bone, Blood Meal and Soy Protein on a Sand-based Green, Purdue University: 2007.
Objective
To evaluate the release characteristics and subsequent turfgrass effects after treatment with various fertilizers containing differing percentages of soluble organic nitrogen (N) and phosphorus derived from bone, blood meal and soy protein on a sand-based creeping bentgrass green.
Experimental Procedures:
This field study was conducted at the William H. Daniel Turfgrass Research and Diagnostic Center at Purdue University, West Lafayette IN, during the summer of 2007. The study areas consisted of a mature stand of creeping bentgrass (Agrostis stolonifera ‘Pennlinks’) cultivated on a sand-based (80:20 sand: peat pH= 8.1) research putting green. The study area was mowed regularly at 0.140 inches daily with clippings collected and irrigated to promote growth. Insecticides and fungicides were applied on a curative basis when required.
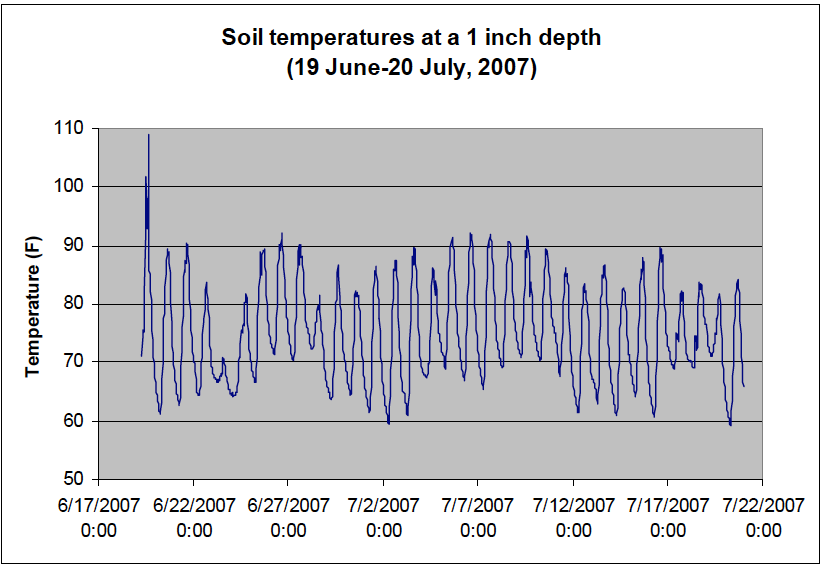
All fertilizer treatments other than urea were applied with a shaker bottle at a rate equivalent to 1.0 lb. actual N 1000 ft2 and watered in with approximately 0.25 in of irrigation. The study area remained unmowed for two days following initial application to ensure the granular fertilizers had sufficient time to dissolve into the turf canopy and were less likely to be picked up by the mower. The urea treatment was dissolved in water and applied with pressurized CO2 (35 psi) sprayer equipped with TeeJet XR 8003 tips calibrated to deliver 2.0 gallons of spray volume per 1000 ft2. Treatments were initiated on 21 May. Plots receiving urea only were applied 4x on 14 day intervals with subsequent applications occurring on 4 and 18 June and 2 July, 2007. Experimental plots were 5 x 10 ft and arranged in a randomized complete block with three replications of each treatment. Nutralene (38-0-0), Earthworks 5-4-5 and foliarly applied urea were included as industry standards for comparison of the Grigg Bros. products. In addition to the quantitative data for the treatments listed below, rootzone soil temperatures were recorded using a continuously logging HOBO data probe at a 1 inch depth throughout the study period from 19 June – 20 July (Onset Corp. Pocasset, MA).
Data collected: Plots were visually assessed for overall turfgrass quality and color. Other measurements included canopy greenness by reflectance, clipping yield and percentage leaf tissue N and ball roll distance. Creeping bentgrass quality was assessed on a 0-9 scale with 0=poor quality turf, 9-optimum greenness, density and uniformity with 7=acceptable putting green turf. Color was assessed on a 0-9 with 0=brown turf and 9=dark green turf. Canopy greenness was measured using a hand-held reflectance meter (FieldScout CM-1000, Spectrum Technologies Inc.) measuring five locations in each plot on a systematic grid pattern that measured the center and four corners of each plot. Clippings were collected once weekly with a walking greensmower for yield. Prior to clipping collection the study area was unmowed for two-three days to allow sufficient growth for clipping collection. Clippings were dried and ground and a subsample was used to determine leaf tissue N was by ignition using a LECO CHN-2000 analyzer (LECO Corp., St. Joseph, MI). Ball roll was determined using a Stimpmeter designed for small plot research with a shorter, 38 cm, ball release notch. All data was subjected to analysis of variance using the SAS system (Statistical Analysis Systems Institute Inc., Cary, N.C.) and mean separation performed using Fisher’s protected least significant difference test at the (P<0.05) level.
Results
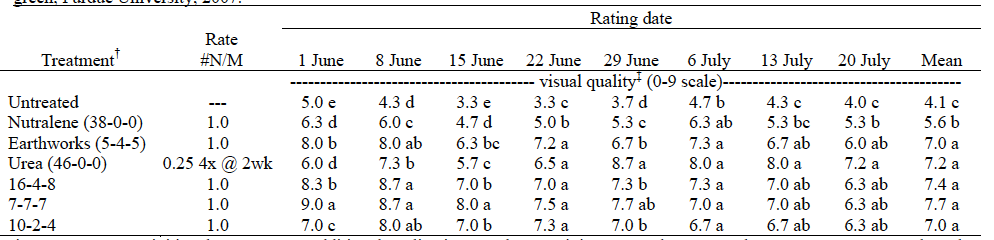
For visual appearance or turfgrass quality the mean values recorded ranged from 3.3 to 9.0 with a study mean for treatments ranging from 4.1 to 7.7 (Table 1). For the overall mean there was no difference between five products which had values ranging from 7.0 to 7.7. These products were superior to Nutralene, and the unfertilized control, with values of 5.6 and 4.1, respectively. The most consistently superior product was 7-7-7 which was statistically the highest on all eight rating dates. Most of the better performing products had relatively high ratings, > 7.0, throughout most of the study. The exception was foliarly applied urea (0.25 lb. N every 14 days) which initially had relatively poor quality ratings, < 7.0, for the first half of the study. By the end of the study, however, this treatment was in the top statistical category on the last five rating dates.
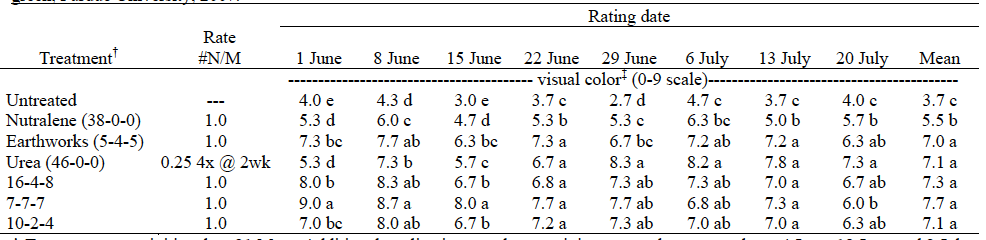
For visual color ratings, the values ranged from 2.7 to 9.0 with study mean values ranging from 3.7 to 7.7 (Table 2-Figure 1). The values for color generally, followed the same pattern as those recorded for turfgrass quality (Table 1). The same five products, Earthworks 5-4-5, urea, 16-4-8, 7-7-7 and 10-2-4 had values, > 7.0 and were superior to Nutralene and the unfertilized control. One additional observation worth mentioning is that at no time during this study were the products evaluated injurious to the turf. There was no bronzing or tip burn observed for any product. For canopy greenness as measured by reflectance, the values ranged from 168 to 298 spectrum units and study mean values ranged from 193 to 258 (Table 3). When evaluating the study means one product was superior to all others, 7-7-7, with an average value of 259. This product was similar to 16-4-8 which was similar to Earthworks 5-4-5, urea and 10-2-4. All of these products were superior to Nutralene and the unfertilized control. The most consistently green product was 7-7-7 being in the top statistical group on seven of eight measurement dates. On the last measurement date, however, only one treatment was statistically superior, the urea treatment. This is probably due to the fact that by this point, eight weeks after study initiation, the N effects of the granular products had dissipated. By contrast, the urea treated plots had been more recently applied, and hence the greener canopy was measured.
For clipping yields, the overall treatment differences were similar to those observed for turfgrass quality and color (Table 4). For example, those treatments producing superior visual quality and color and higher canopy greenness values, (e.g. 7-7-7 and 16-4-8) also resulted in significantly more clipping yields. This is most likely due to the greater turfgrass vigor which also results in a healthier looking turf. Among harvest dates, the first harvest date had the highest yields, ranging from 24-86 kg ha-1 per day, with the highest yields associated with 7-7-7 and 16-4-8. The lowest clipping yield was associated with the unfertilized control, Nutralene and foliarly applied urea treatments. The higher yields for the first harvest would be expected for most fertilizers since the fertilizers were applied at 1 lb. of actual N and the presence of more available N results in faster greening, more growth and subsequently higher clipping yields. These product trends persisted through the remainder of the study and were also reflected in the mean clipping yields as well for the eight clipping harvests which ranged from 26 to 42 24-86 kg ha-1 per day.
For ball roll distance which is a functional measurement of canopy growth, mean distances ranged from 48 to 70 inches with higher values recorded on the second measurement date, 13 July. There was no significant difference among treatments on 2 July, however on 13 July those plots with less greenness and growth (e.g. unfertilized and Nutralene) generally had longer ball roll distances than those plots possessing greater vigor.
Leaf tissue was analyzed for N content at one, two, four and eight weeks after initial fertilizer application and values ranged from 0.7 to 3.7 % leaf tissue N (Table 6). The most variability in treatments occurred on the first and second clipping harvest dates. On 29 May values ranged from 1.5 to 3.4 % N, while on 4 June values ranged from 0.7 to 3.7 % N. The most consistent leaf tissue N level occurred for the 7-7-7 granular fertilizer which was in the highest statistical category on all four collection dates. This was followed by the 16-4-8 and 10-2-4 products. The lowest leaf tissue N was associated with the untreated and liquid urea treatments.
Acknowledgements
This research was conducted with the generous support of the Mid-West Regional Turf Foundation and GRIGG Foliar Fertilizers.
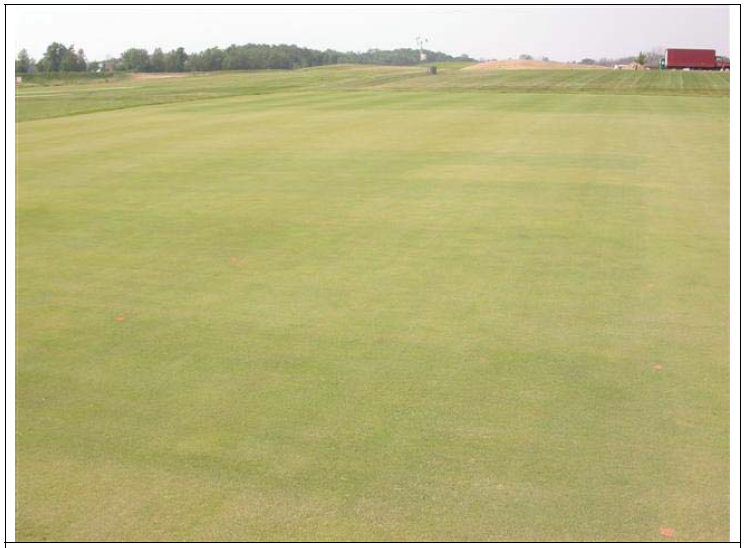
Figure 1. Overview of the study area showing differences in canopy greenness as affected by the various fertilizer products, (Photo taken 24 May, 2007). From the foreground plot (5 x 10 ft) the treatments are 16-4-8, foliar urea (0.25 lb. N 1000 ft2 – 14 days) , 10-2-4, Nutralene (38-0-0), Earthworks (5-4-5), unfertilized control and 7-7-7.
† Treatments were initiated on 21 May. Additional applications to plots receiving urea only were made on 4 June, 18 June and 2 July.
‡ Creeping bentgrass quality was assessed on a 0-9 scale with 0=poor quality turf, 9-excellent and 7=acceptable turf.
* Means in the same column followed by the same letter are not significantly different according to Fisher’s protected LSD (P=0.05).
Table 1. Visual turfgrass quality ratings as affected by various fertilizer applications on a sand based, creeping bentgrass ‘Pennlinks’ green, Purdue University, 2007.
† Treatments were initiated on 21 May. Additional applications to plots receiving urea only were made on 4 June, 18 June and 2 July.
‡ Creeping bentgrass color was assessed on a 0-9 with 0=brown turf and 9=dark green turf.
* Means in the same column followed by the same letter are not significantly different according to Fisher’s protected LSD (P=0.05).
Table 2. Visual turfgrass color ratings as affected by various fertilizer applications on a sand based, creeping bentgrass ‘Pennlinks’ green, Purdue University, 2007.
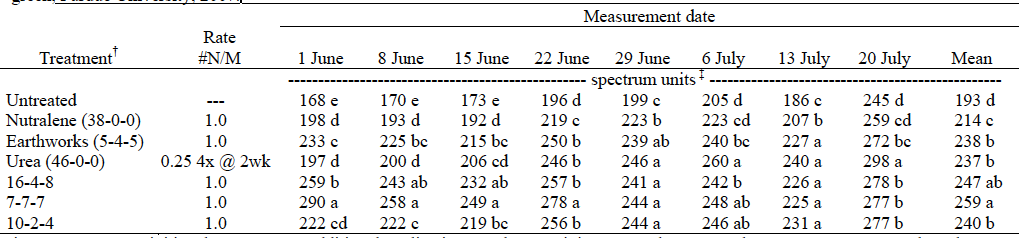
† Treatments were initiated on 21 May. Additional applications to plots receiving urea only were made on 4 June, 18 June and 2 July.
‡ Canopy greenness measurements were recorded using a hand-held meter (FieldScout CM-1000, Spectrum Technologies Inc.) measuring five locations in each plot on a systematic grid pattern.
* Means in the same column followed by the same letter are not significantly different according to Fisher’s protected LSD (P=0.05).
Table 3. Canopy greenness measurements as affected by various fertilizer applications on a sand based, creeping bentgrass ‘Pennlinks’ green, Purdue University, 2007.
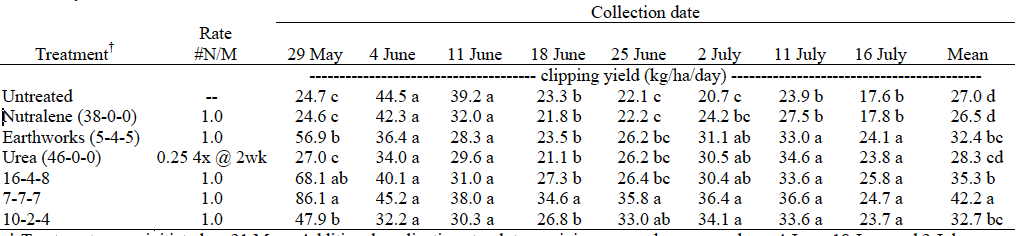
† Treatments were initiated on 21 May. Additional applications to plots receiving urea only were made on 4 June, 18 June and 2 July.
‡ Clippings were collected weekly with a walking greensmower for yield.
* Means in the same column followed by the same letter are not significantly different according to Fisher’s protected LSD (P=0.05).
Table 4. Clipping yield as affected by various fertilizer applications on a sand based, creeping bentgrass ‘Pennlinks’ green, Purdue University, 2007.
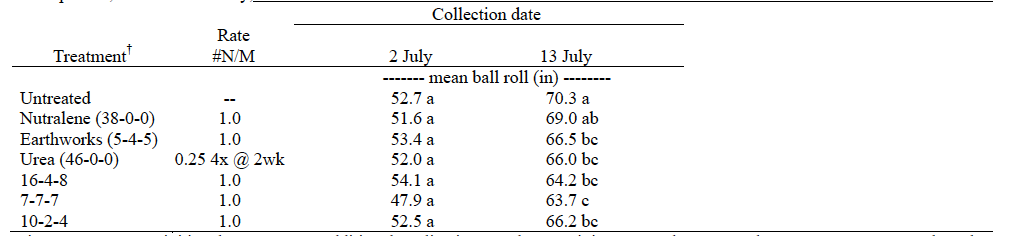
† Treatments were initiated on 21 May. Additional applications to plots receiving urea only were made on 4 June, 18 June and 2 July.
‡ Ball roll was determined using a modified Stimpmeter designed for small plot research with a shorter ball release notch.
* Means in the same column followed by the same letter are not significantly different according to Fisher’s protected LSD (P=0.05).
Table 5. Ball roll as affected by various fertilizer applications on a sand-based, creeping bentgrass ‘Pennlinks’ green using a modified Stimpmeter, Purdue University, 2007.

† Treatments were initiated on 21 May. Additional applications to plots receiving urea only were made on 4 June, 18 June and 2 July.
‡ Clippings were collected weekly with a walking greensmower for yield and %N was determined with a LECO CHN-2000 analyzer.
* Means in the same column followed by the same letter are not significantly different according to Fisher’s protected LSD (P=0.05).
Table 6. Leaf tissue nitrogen (N) content as affected by various fertilizer applications on a sand based, creeping bentgrass ‘Pennlinks’ green, Purdue University, 2007.